Linux offers various commands that supply details about disk and system activity as well as system and resource statistics. One of the most valuable commands is dstat. It delivers an extensive array of detailed statistics on system activity.
If dstat is not yet installed on your Linux system, you can use a command like one of these given root access:
For Redhat and similar distributions, use:
For Ubuntu, Debian, and related distributions, use:
Disk activity encompasses not only the capacity of your disks but also their busy state due to various ongoing read and write operations initiated by multiple commands. To specifically view the disk read and write statistics, you can use the -d option. The output should appear similar to this:
Note that the output includes separate columns for disk reads and disk writes.
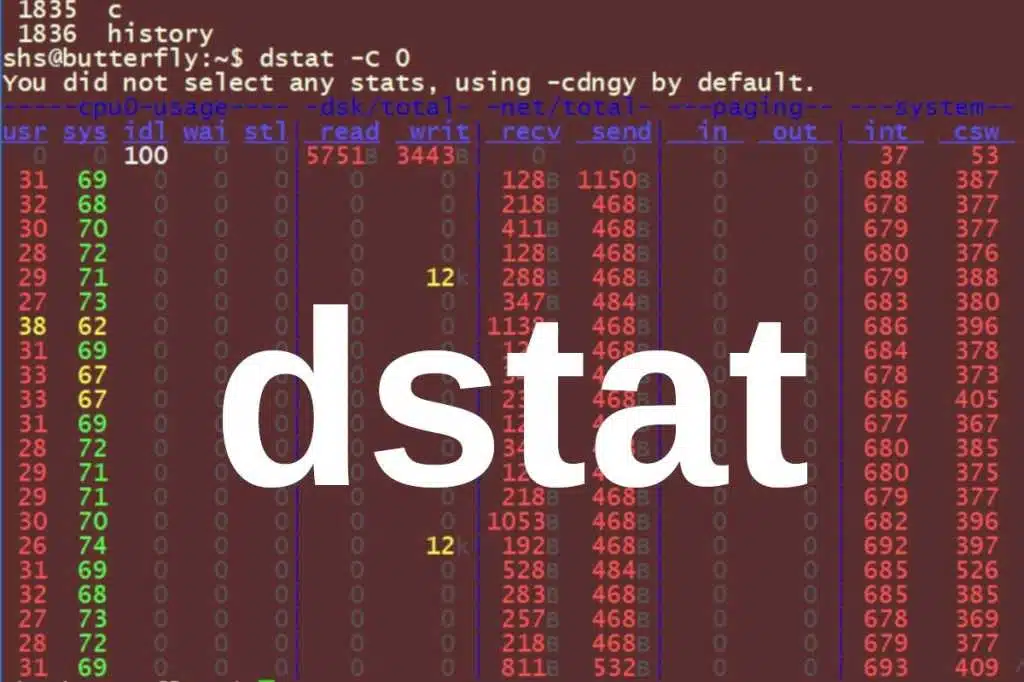
If you use the dstat command without any options, the output will be far more detailed than expected, resembling what is shown below.
This output displays statistics regarding CPU usage, disk read and write activities, network traffic, paging, and system information. The result of running dstat without options is equivalent to using it with the “cdngy” options (dstat -cdngy).
To get eight lines of this information in 2-second intervals, add the numeric arguments as shown in this command:
Note that the dstat command doesn’t always come with a man page. However, you can get a list of the command’s options and what each option represents using the dstat –help command.
The cdngy arguments (as you can tell from the output above) represent cpu, disk, network, paging and system stats. To display used and free memory with dstat, use a command like this:
To display top CPU usages, you could use a command like this:
With the dstat -c (CPU) option, dstat displays CPU stats. In the example below, we’re asking for two-second intervals and six reports.
One key to becoming adept at evaluating system performance is to run commands like these periodically — even when you don’t see the need to question how well a system is running. If you come to know what normal performance looks like for a server, you will have a much easier time spotting problems.
The commands included in this post display some of the most useful dstat command options, but check the options list for others that will help you see the details that you most need to see. The dstat command provides a vast range of options for viewing system and resource stats.
ChicagoVPS is your gateway to unparalleled hosting solutions. Our state-of-the-art datacenters and powerful network ensures lightning-fast speeds and uninterrupted connectivity for your websites and applications. Whether you’re a startup looking for scalable resources or an enterprise in need of enterprise-grade hosting, our range of plans and customizable solutions guarantee a perfect fit. Trust in ChicagoVPS to deliver excellence, combining unmatched reliability and top-tier support.
For Inquiries or to receive a personalized quote, please reach out to us through our contact form here or email us at sales@chicagovps.net.